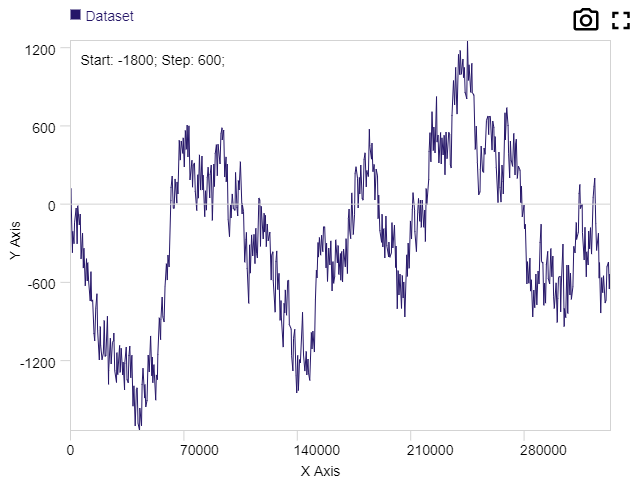
Plotfast Canvas Graphs
I was recently attempting to replace some native data capture software with a web-based version and came across the problem of displaying data. While many plotting solutions exist, I wasn’t able to find any (free) ones that were able to handle the data I wanted to show. So, I decided to try my hand at making my own.

Originally I was planning to display data rendered natively server-side, but it turned out that V8 is actually pretty darn fast. I was able to push it up to tens of millions of points using cleverly-timed downsampling (largest triangle three buckets) and ignoring data that I didn’t need at the moment. The bottleneck eventually turned out to be space; too many points would cause the Chrome tab to run out of memory.
Try out the live demo with 1M points here!
I’m pretty happy with the result, but it needs some usability and configuration tweaks to make it more versatile.
Got feedback or questions?
Send a comment